


News of the ‘Great Wealth Transfer’ circulated during 2025, as economists predict that Gen X and Millennials are set to inherit $124 trillion in assets over the next 23 years. [1]
With this in mind, a recent survey from The Harris Poll revealed that nearly 10% of Americans felt less pressure to save because they expect to inherit money. [2] But, is this wise?
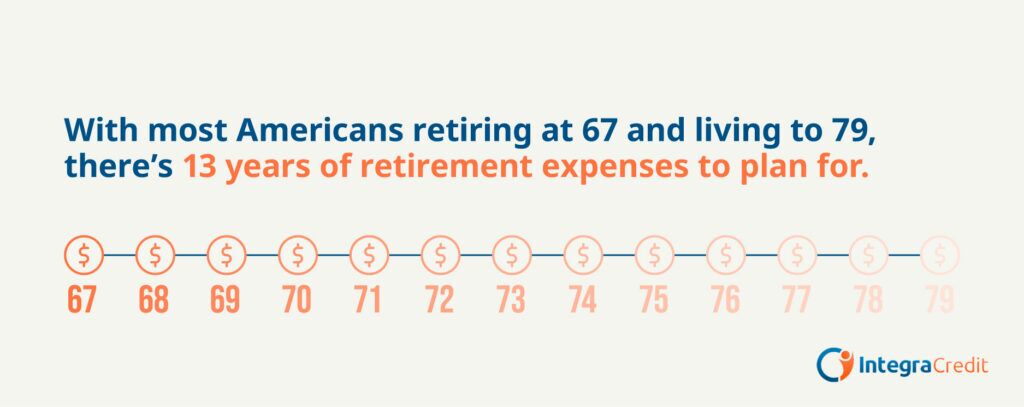
With many Americans becoming more relaxed about their future finances due to expected inheritance, we conducted research to understand the current retirement wealth landscape. With the average American retiring at 67 years old [3] and the average life expectancy being 79 [4], our research suggests Americans need to budget for a minimum of 13 years of spending to maintain their lifestyle during retirement.
With this in mind, we’ve analyzed data from a range of sources. Retirement income by state figures were sourced from WiseVoter, using the latest available data to represent average annual income for retirees in each state. Healthcare spending by age was derived from RegisteredNursing.org, providing benchmark healthcare costs that increase with age.
Average retirement spending data was obtained from SmartAsset, which outlines average annual expenditures across key categories including housing, healthcare, transportation, food, taxes, entertainment, apparel, and other costs.
Net worth for individuals aged 67-79 was drawn from the Federal Reserve’s Survey of Consumer Finances and represents the typical starting wealth at retirement. Housing milestones and age of first-time buyers were referenced from NAR.
By combining average net worth and retirement income with average annual expenses across these key categories, our analysis explores the level of wealth likely to remain at each of the retirement ages.
Key findings:
- Americans are living longer, but retirement wealth isn’t keeping pace, leaving many at risk of outliving their savings.
- Americans need to budget for a minimum of 13 years of spending to maintain their lifestyle during retirement.
- At the point of retirement, households face an annual income shortfall of $30,201.
- Even when major expenses such as mortgage payments end around age 68, average yearly spending remains close to $37,000, leaving a continued deficit of nearly $9,500 per year.
- By age 98, the average retiree has exhausted their savings entirely and starts to hit negative figures, meaning they’re living beyond their means.
- With an average of $27,617 in annual income and $342,383 in net worth, the average U.S. retiree household spends $524,682 over 13 years, ending with $176,722 at life expectancy (age 79).
- Americans in Alaska, Maryland, Virginia, California and Colorado have between $286,000 and $238,628 left for their family to inherit at the age 79.
- On average, people in Indiana, West Virginia, Arkansas, Kansas, and Mississippi, will end their retirement with between $84,747 and $121,212 – the lowest amounts in the study.
A full list of sources and methodology can be found at the end of this analysis.
Retirement wealth reduces over time
Our data analysis of retirement spending and savings data across the U.S. revealed that retirement wealth actually erodes at a staggering rate during the average retirement lifespan of 13 years, unwanted news for those depending on inheritance over building their own pot of savings.

At the point of retirement, typically age 67, [3] the research found that a typical household has a median net worth of $342,383 and earns roughly $27,600 per year in retirement income. However, with annual spending averaging $57,800, there is immediately an annual income shortfall of $30,201.
This gap might force individuals to make more use of their savings early on during retirement, and that depletion accelerates as the years progress. Even when major expenses such as mortgage payments end around age 68, [6] average yearly spending remains close to $37,000, leaving a continued deficit of nearly $9,500 per year.
By the time retirees reach age 79, the average U.S. life expectancy [4], their remaining wealth has typically fallen to $176,722. Within just 20 more years, that balance disappears completely. By age 98, the average retiree has exhausted their savings entirely and starts to hit negative figures, meaning they’re living beyond their means.

At age 98, our model shows an average deficit of $5,089, which deepens to $24,227 by age 100. In other words, each additional year of life after the mid nineties worsens financial strain and erodes any wealth that may be passed down as inheritance.
Over the retirement period analyzed (between ages 67-100), the total cost of living exceeds $524,682. Meaning that while people are living longer, [7] retirement wealth is not keeping pace. Without significant planning or additional income sources, Americans may outlive their savings and the inheritance they hoped to leave behind.
Inheritance erosion across America
The research examined the typical expenses a retiree can expect to face throughout retirement. Although housing remains the most significant cost, other essentials, including healthcare, food, and transportation, can also place considerable pressure on a retirement budget.
| Retirement Expense | Amount per year |
| Housing | $20,632 |
| Healthcare | $7,540 |
| Transportation | $8,172 |
| Food | $7,306 |
| Taxes | $3,466 |
| Entertainment | $2,672 |
| Apparel | $1,130 |
| Other | $6,900 |
Average U.S. Retirement Budget
| Yearly retirement income per household | $27,617 |
| Total retirement income over 13 years | $359,021 |
| Avg. net worth for 67-79 year old | $342,383 |
| Total spending | $524,682 |
| Money left at 79 years old | $176,722 |
Across the U.S., the average retiree household earns around $27,617 per year in retirement income and begins with a median net worth of $342,383. Over a typical 13-year retirement, total household spending reaches $524,682, leaving an average of $176,722 remaining at age 79.
States where retirement savings stretch further
We took our research to another level and undertook a state-by-state analysis, which reveals striking differences in how well retirees can preserve their wealth across the U.S.
Taxes play an important role in whether people preserve or lose their retirement wealth. Our analysis of state-level retirement income reveals a clear pattern that those in tax-friendly states retain more of their income and inheritance potential.
A handful of states stand out for healthier retirement wealth pictures. According to the analysis, retired Americans in Alaska, Maryland, Virginia, California and Colorado finish retirement with between $286,000 and $238,628 left to pass on at age 79, the highest levels of retained wealth in the country.
| State | Yearly retirement income per household | Total retirement income over 13 years | Average net worth for 67-79 year old | Tax on pension? | Total spending | Money left |
| Alaska | $36,023 | $468,299 | $342,383 | No | $524,682 | $286,000 |
| Maryland | $35,732 | $464,516 | $342,383 | Yes | $524,682 | $282,217 |
| Virginia | $35,306 | $458,978 | $342,383 | Yes | $524,682 | $276,679 |
| California | $34,737 | $451,581 | $342,383 | Yes | $524,682 | $269,282 |
| Colorado | $32,379 | $420,927 | $342,383 | Yes | $524,682 | $238,628 |
| Hawaii | $32,294 | $419,822 | $342,383 | No | $524,682 | $237,523 |
| Connecticut | $32,052 | $416,676 | $342,383 | Yes | $524,682 | $234,377 |
| Delaware | $31,283 | $406,679 | $342,383 | Yes | $524,682 | $224,380 |
| Illinois | $31,223 | $405,899 | $342,383 | No | $524,682 | $223,600 |
| Massachusetts | $31,198 | $405,574 | $342,383 | Yes | $524,682 | $223,275 |
| Nevada | $31,171 | $405,223 | $342,383 | No | $524,682 | $222,924 |
These states benefit the most from higher average retirement incomes between $32,000 and $36,000 per year, and generally have more tax-friendly policies for those in retirement. [8]
Worst States for Retirement Savings
At the other end of the scale, those retiring in parts of the Midwest and Appalachia struggle to keep pace with their outgoings. In Indiana, West Virginia, Arkansas, Iowa, Kansas, and Mississippi, people end retirement with between $84,747 and $121,212, the lowest amounts in the study.
| State | Yearly retirement income per household | Total retirement income over 13 years | Average net worth for 67-79 year old | Total spending | Money left |
| Indiana | $20,542 | $267,046 | $342,383 | $524,682 | $84,747 |
| West Virginia | $21,118 | $274,534 | $342,383 | $524,682 | $92,235 |
| Arkansas | $21,967 | $285,571 | $342,383 | $524,682 | $103,272 |
| Iowa | $22,308 | $290,004 | $342,383 | $524,682 | $107,705 |
| Kansas | $23,294 | $302,822 | $342,383 | $524,682 | $120,523 |
| Mississippi | $23,347 | $303,511 | $342,383 | $524,682 | $121,212 |
| North Dakota | $23,347 | $303,511 | $342,383 | $524,682 | $121,212 |
| Tennessee | $23,715 | $308,295 | $342,383 | $524,682 | $125,996 |
| Nebraska | $23,821 | $309,673 | $342,383 | $524,682 | $127,374 |
| Oklahoma | $23,963 | $311,519 | $342,383 | $524,682 | $129,220 |
| South Dakota | $24,020 | $312,260 | $342,383 | $524,682 | $129,961 |
| Missouri | $24,125 | $313,625 | $342,383 | $524,682 | $131,326 |
In these states, average annual retirement income sits below $23,500, but total costs remain the same as the national average at $524,682 over the 13 years of expected retirement. Essential costs remain steady across regions, with housing averaging $20,632 per year for two years (until the average age it is paid off), healthcare at $7,540, and transportation at $8,172. However, tax burdens also play a role. Many of these states are less tax-friendly for retirees, with pension income and Social Security often taxed in full or in part. [8]
Most expensive retirement expenses
Retirement wealth depletes so quickly due to the ongoing expenses that life requires, even after working life has stopped. According to data from the Bureau of Labour Statistics, the average American retiree spends $57,818 per year until their mortgage is paid off at age around 68 [6], with the majority of that amount going towards essential, recurring costs. [9]
| Spending Category | Average Annual Cost | Share of Total Spending |
| Housing (until age 68*) | $20,632 | 35.2% |
| Transportation | $8,172 | 14.1% |
| Healthcare | $7,540 | 13.0% |
| Food | $7,306 | 12.6% |
| Other | $6,900 | 11.9% |
| Taxes | $3,466 | 5.7% |
| Entertainment | $2,672 | 4.7% |
| Apparel | $1,130 | 2.0% |
| Total | $57,818 | ≈100% |
*Most first time buyers are aged 38 and take out a 30 year loan. [6]
Housing
Research from the National Association of Realtors shows that most people buy their first home at around 38 and take out a 30-year loan. This means the average homeowner finishes paying off their mortgage at about 68, with annual payments averaging $20,632, [6] meaning that this is an ongoing cost to consider if retiring at age 62.
Healthcare
The data shows that healthcare ranks as the third-largest expense during retirement, but it is also rising faster than any other category. At around $7,500 per year, medical expenses make up 13% of the average retiree’s budget, [9] which could continue to climb sharply as lifespan lengthens and long-term care needs increase. [10]
Everyday essentials
Data shows that transportation (14%) and food (13%) together account for more than a quarter of total spending annually in retirement. [9] These recurring costs highlight how maintaining independence during retirement requires a steady income, even once individuals own their own homes.
Overall, the analysis shows that luxury categories such as entertainment and apparel make up less than 7% of total annual spending combined. This means that nearly every dollar spent in retirement goes towards necessities, a key cause of lowering inheritance for other generations.
Should we rely on inheritance instead of savings?
For those left behind when the sad time comes, inheritance may be considered a lifeline, a final gift that helps cover major costs or offer financial security. However, our analysis shows that this expectation may not reflect reality.
Retirement wealth often gets consumed at an increasing rate due to the ongoing expenses living longer requires such as medical, residential care or even funeral costs, meaning those planning on relying on a future windfall are increasingly risky.
For younger generations, inheritance should only be seen as a bonus, not a budget. Building independent savings, investing early and preparing for unexpected costs are much more reliable paths to long-term financial security than family wealth.
Methodology
Data for this report were collected and analyzed in October 2025.
The goal was to estimate how retirement income, healthcare costs, and long-term expenses affect the amount of wealth Americans are likely to retain throughout retirement.
Retirement Income by State figures were sourced from WiseVoter, using the latest available data to represent average annual income for retirees in each state.
Healthcare Spending by Age was derived from RegisteredNursing.org, providing benchmark healthcare costs that increase with age. These costs were used to estimate annual healthcare spending as a percentage of total retirement expenses.
Average Retirement Spending data were obtained from SmartAsset, which outlines average annual expenditures across key categories — housing, healthcare, transportation, food, taxes, entertainment, apparel, and other costs. Percentages from each category were used to create a baseline annual spending model.
Net Worth for Individuals Aged 67–79 was drawn from the Federal Reserve’s Survey of Consumer Finances and represents the typical starting wealth at retirement.
Housing Milestones and Age of First-Time Buyers were referenced from NAR, which notes that most Americans purchase their first home in their mid-thirties. The study calculated when the average mortgage will be paid off by adding a typical 30 year term to this age, assuming most will pay off their mortgage by 68.
Using these datasets, the analysis modeled the financial trajectory of a typical retiree beginning at age 67. Annual retirement income was compared to total spending across 13 years, the typical span from retirement to the national life expectancy of 79. The difference between income and spending was used to calculate yearly savings drawdowns and estimate remaining wealth at each age.
For the state-by-state comparison, retirement income, tax friendliness, and healthcare spending data were combined to project how costs vary geographically. Each state’s “money left” figure reflects the projected inheritance remaining after total living expenses over 13 years.
All figures represent national or state-level averages and are intended to illustrate general trends in retirement spending and inheritance erosion rather than individual financial outcomes.
Sources
[1] Investopedia, ‘America’s Great Wealth Transfer’, 2025. Accessed October 2025.
[2] Realtor.com, ‘Americans Are Counting on Inheritance’, 2025. Accessed October 2025.
[3] Nerd Wallet, ‘What Is the Average Retirement Age in the U.S.?’, 2025. Accessed October 2025.
[4] National Center for Health Statistics, ‘Life Expectancy’, 2025. Accessed October 2025.
[5] Forbes, ‘Life Expectancy After Retirement’, 2024. Accessed October 2025.
[6] National Association of Realtors, ‘First-Time Home Buyers Shrink to Historic Low’, 2024. Accessed October 2025.
[7] CBS News. ‘Americans are Living Longer’, 2025. Accessed October 2025.
[8] Wise Voter, ‘Average Retirement Income’, 2025. Accessed October 2025.
[9] Smart Asset, ‘The Average Retirement Budget’, 2025. Accessed October 2025.
[10] National Library of Medicine, ‘Healthcare on the Brink’, 2024. Accessed October 2025.
Apply in minutes, quickly & securely
- Complete an online application
- Receive a decision quickly
- Review and sign the agreement
- Get cash directly into your bank account
